
This dashboard explores the key drivers behind customer complaints and order cancellations within a grocery delivery service. By connecting delivery outcomes to operational patterns across multiple stores, it aims to spotlight the primary factors impacting customer satisfaction and to uncover actionable insights for reducing order churn and improving service quality.
Project Overview
This project analyzes customer complaints and order cancellations in doordash grocery delivery service. By examining complaint and cancellation patterns, the dashboard aims to identify root causes of customer dissatisfaction and propose actionable insights for business improvement. Data visualizations compare store performance, delivery issues, and product categories most often associated with negative experiences.
Storytelling
The analysis reveals important patterns across the delivery network. When comparing stores, it becomes clear that the store 2 stands out with both the highest percentage of customer complaints and the highest order cancellation rate. Store 1, despite having a lower complaint percentage, still maintains a cancellation rate similar to other stores when normalized by order volume.


Digging deeper into causes, customer complaints most commonly arise from three scenarios: receiving a substitute product instead of the originally ordered item, deliveries taking longer than 20 minutes, and miscellaneous reasons labeled as “Other.” Interestingly, the majority of both complaints and cancellations fall into this “Other” category, suggesting unmeasured or more complex drivers, such as delivery personnel interactions or app experience.

A key insight is that cancellations most often occur when a requested product is simply unavailable and there is no substitute offered. This makes intuitive sense—customers are more likely to cancel when their needs can’t be met. Complaints, on the other hand, spike when customers receive an unwanted substitute or when orders are delayed, pointing to unmet expectations rather than total order failure.
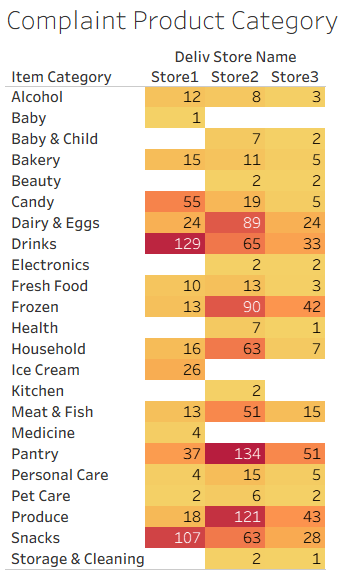
Product category analysis shows that complaints cluster around produce, pantry, and drink items, potentially reflecting high expectations for freshness (produce), specific brand loyalty (pantry/drinks), or disappointment in quality. Cancellation data, meanwhile, is most concentrated among drinks and snacks—categories likely chosen for impulse or convenience, making customers less hesitant to cancel if those items are unavailable.

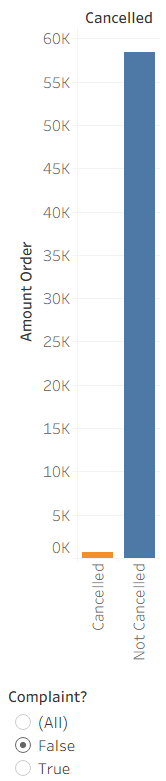
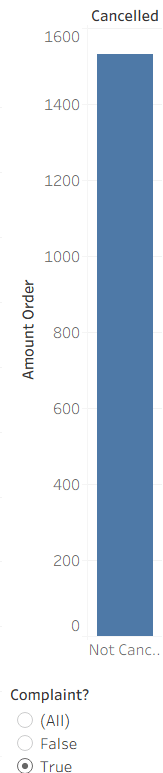
A surprising finding is that the majority of customers who lodge complaints do not proceed to cancel their orders. This could indicate that complaints are typically submitted after receiving a product, or there may be app constraints that prevent post-cancellation complaints from being recorded.
Filtered without Complaint
Filtered with Complaint
Business Opportunities and Recommendations
- Enhance Inventory Accuracy: Minimize missing items and improve substitution logic to reduce both complaints and cancellations.
- Improve Communication: Set clearer expectations about substitutions and delivery times. Offer opt-out choices or approval for substitutes before delivery.
- Address “Other” Causes: Investigate the large share of “Other” complaints and cancellations by following up with customers for direct feedback or analyzing app/driver interactions.
- Focus on Product Quality: Place extra attention on categories with the highest complaint rates (produce, pantry, drinks) through supplier controls and handling procedures.
- Empower Post-Cancellation Feedback: Enable customers to submit feedback even after cancelling, closing the loop on lost orders and capturing reasons currently missed.
