
This project investigates worldwide CO2 emissions trends, energy consumption breakdowns, and the evolving relationship between renewable energy adoption and overall emissions. Through interactive data visualizations, the project aims to highlight how energy choices impact the environment and to challenge commonly held assumptions about the role of renewables in emissions reduction.
Project Overview
Developed as an interactive dashboard, this application visualizes international CO2 emissions, annual energy use, and shifts in energy sources over the past two decades. Users can explore geospatial maps and historical data to analyze how renewables and fossil fuels factor into current energy systems. The dashboard serves as both an educational resource and a tool for policy evaluation.
Storytelling
The map shows that CO2 emissions vary by country and year—with some rising, some falling, and many staying steady. The key question is: how can emissions be reduced?
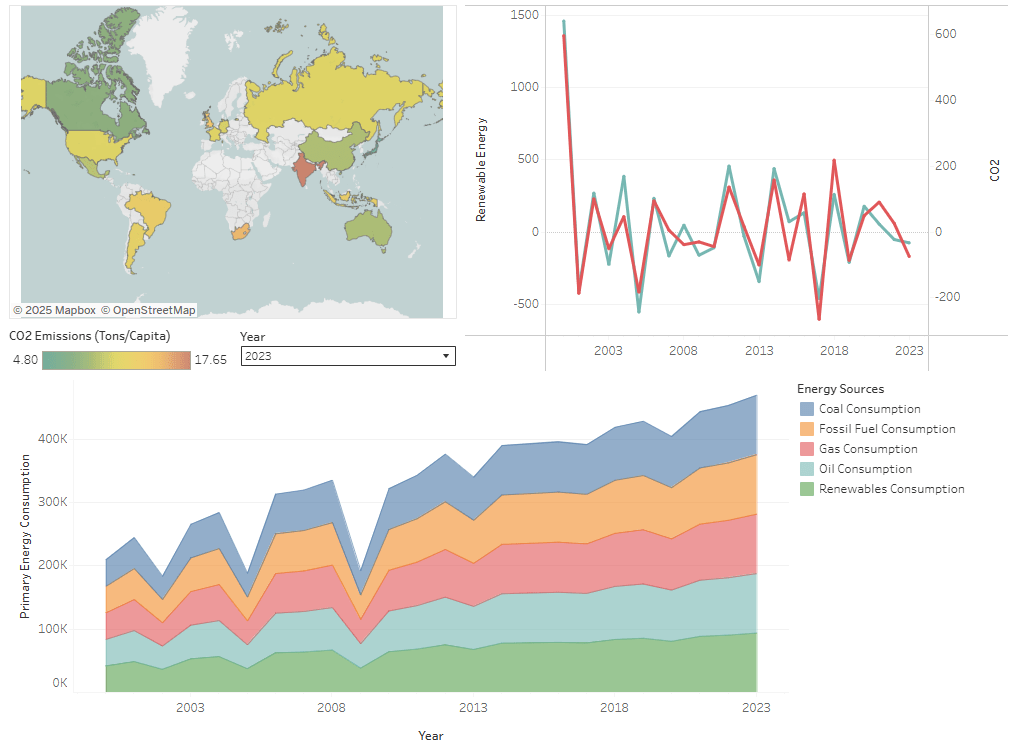
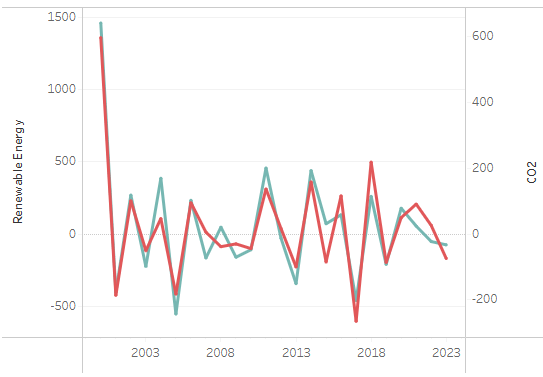
Conventional wisdom often assumes that boosting renewables immediately cuts emissions, but the data tells a different story as we can see how Renewable Energy has the same pattern as CO2 Emission.
Instead of replacing fossil fuels, renewables are added to meet ever-increasing energy demand—a pattern reflected in the steady or rising consumption of coal, oil, and gas.

Thus, both renewables and emissions trend upward together, challenging the notion that simply increasing renewables will solve the carbon problem.
Policy Recommendations
These trends indicate a need for new policy frameworks focused not just on promoting renewables but also on actively reducing fossil fuel consumption. Effective measures might include:
- Implementing stricter regulations or caps on fossil fuel use.
- Incentivizing energy efficiency and conservation.
- Setting clear targets for phasing out coal and oil in favor of renewables.
- Promoting technology and infrastructure that enable renewables to become true substitutes, not just additions.
